I hope your 2023 is off to a great start. Our first open homes kicked off on the 7th and we have been pleasantly surprised with the level of activity and offers we have received so far.
2023 is going to be an interesting year and as property is a favourite topic in New Zealand, it will be all eyes on the market, with the impact of higher interest rates and general economic uncertainty throwing caution to the wind. That’s nothing new though, we’ve been in this environment for over a year now, so will there be much change in the year ahead?
We thought we’d already entered the endgame for price declines then inflation came in a lot higher than anticipated, the RBNZ cranked the OCR up higher than we all thought they would and then on November 23 they told us they wanted a recession, among other scary sounding things. So of course the market has responded as you would expect, but this can’t go on forever.
Interest rates will eventually peak, and price declines will eventually flatten off, when that happens getting buyers and sellers to meet will become easier and sales volumes will improve. We will also definitely start to see some investors and even the odd home-owner getting into a position where they need to sell, which will again add to volume.
But at the same time, as interest rates start to fall again we will start to see more investors looking to scoop up bargains or a purchase at the bottom of the market. We all know that prices will eventually rise again and as everybody likes to buy at the bottom, this should lead to more buyers. Add to that National potentially coming into power and repealing the interest tax deductibility rules and maybe the CCFA, that will lead to easier lending and more investors as well. The first home buyers will carry on buying, as will buyers just trading up and down. So we should see an increase in buyer acitivity to match if not exceed the supply of property available.
In regards to volume if the trend carries on and we see 40% fall on last year there will basically be nothing to sell, so this surely can’t continue. I expect volume to increase as already mentioned some won’t have a choice but to sell. And the typical owner-occupier turnover will carry on.
The big question is, when this will all happen? Who knows but it could be sooner than we think. I guess what I’m saying is whilst there will probably be some bumps, I’m expecting a better year overall.
And to finish on a positive even with everything over the past year in the media talking about skys falling and prices crashing, they are still up compared to pre-covid levels by 20% nationwide, 12% across Auckland and 11% on the Shore. That’s not too bad.
This Week’s Wrap
– The Short Story
– Market Performance
– Listings & Stock Availability
– Auction Results
The Short Story
During December we saw more of the same, prices continued downward however the rate of decline has definitely slowed. We’ve kicked off the year with decent activity and expect this to grow as more and more people return from holidays and start getting back into the swing of things.
Prices are still down, volume is down, days on market were better again, in fact the best we saw last year. Stock as expected has dropped off for the holiday period as new listings will take a while to begin again. We probably won’t see things return to normal till mid-late Feb.
Why do we use the REINZ House Price Index Data?
I’ve copied this from Tony Alexander – it sums up perfectly why I also only follow the REINZ House Price Index data. I still include the median price but only to give you an idea as to the level, given the HPI on its own is a little meaningless. Eg. The HPI for the North Shore in December was 3507…
“The only house price data I look at, analyse, and comment on are the REINZ House Price Indexes. They are based on sales which actually happened in the month – in this case December – and not title changes based on sales which happened potentially many months ago.
They adjust for changes in the mix of dwellings sold from one month to another so do not get distorted if one month lots of expensive houses sell and the next only the cheap one’s turnover, or one month mainly the sales are of apartments and the next they are mainly standalone houses.“ Tony Alexander
Market Performance – REINZ data for December 22
Median Prices & REINZ House Price Index
House prices have continued on a downward path reducing a further 1.7% nationwide and 2.2% across Auckland to now sit 15% and 17% down respectively, since the peak in November 2021.
Interestingly on the North Shore, things appear to be faring much better with another slight increase in the HPI, which is now equal to August levels and over the past 4 months there has been no change with prices remaining around 16% below the peak.
New Zealand – Dec $790,000 – Peak $925,000 (Nov 21) – 20% above Pre-Covid
Auckland – Dec $1,050,000 – Peak $1,300,000 (Nov 21) – 12% above Pre-Covid
North Shore – Dec $1,280,000 – Peak $1,550,000 (Nov 21) – 11% above Pre-Covid
Sales Volumes
No change here, still through the floor and down all around the country. 47% on the Shore, 45% across Auckland and 39% nationwide. I’m very much looking forward to the January data, as surely these rates of change can’t carry on.
Days on Market
An average of 39 days on the Shore over the past 3 months vs 47 days in the 3 months prior proves what we have been saying that even with the price declines and reduced stock and listings, the market has actually been getting better in terms of actually selling homes.
Across Auckland 41 days over the past 3 months is down from 46 in the 3 months prior and we’ve seen the same trend nationwide with 42 down from 47.
On the Shore the average days for 2023 was 42 days and we wrapped the year up where we started, with 34 days, the shortest we have seen it since Jan which was also 34 days. The peak month November we saw 31 days as the median.
Listings & Stock Availability
Stock levels have dropped considerably over the holiday period but they are starting to climb again and have almost returned to pre-xmas levels. Expect to see more stock hitting the market in the coming weeks and especially mid-late Feb.
North Shore Stock Levels:
1340 on oneroof.co.nz – Pre Xmas Break 1377
1278 on TradeMe.co.nz – Pre Xmas Break 1306
1297 on realestate.co.nz – Pre Xmas Break 1310
Auction Results
No Auction results this week, they will start up again next week. But here’s what we ended the year on last year.
Great to see our average for the year at 44% as given the year we had – one would say this is pretty good indeed.
Harcourts C&C
W/e 27/11 – 49% (18/37)
W/e 04/12 – 39% (7/18)
W/e 11/12 – 43% (10/23)
W/e 18/12 – 29% (5/17)
4 week average 42%
12 week average 44%
Year Average 44%
Barfoot North Shore
W/e 27/11 – 31% (13/42)
W/e 04/12 – 19% (7/37)
W/e 11/12 – 29% (10/35)
W/e 18/12 – 25% (8/32)
4 week average 26%
12 week average 31%
Year Average 29%
Combined 4 Week average: 32%
Combined 12 Week Average: 37%
Auctions with Active Bidders:
78% over past 4 weeks
That’s it from me, remember if you ever have any questions please just give me a call.
Have a great weekend!
_______
Kris Cunningham & Team are all Licensed Sales People under the REAA 2008
NEW LISTINGS

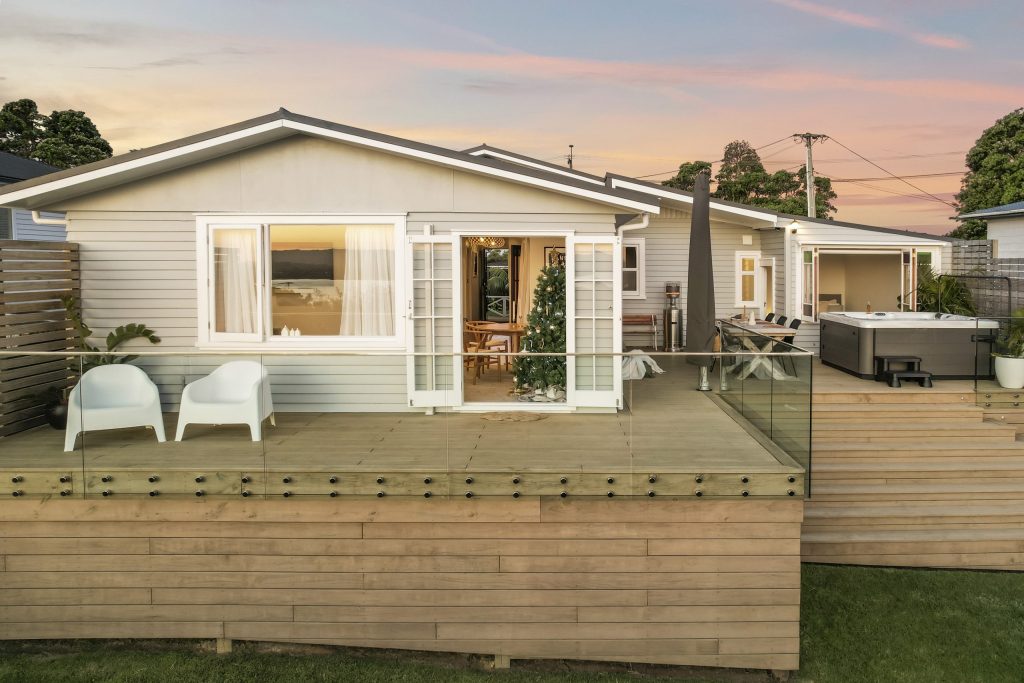
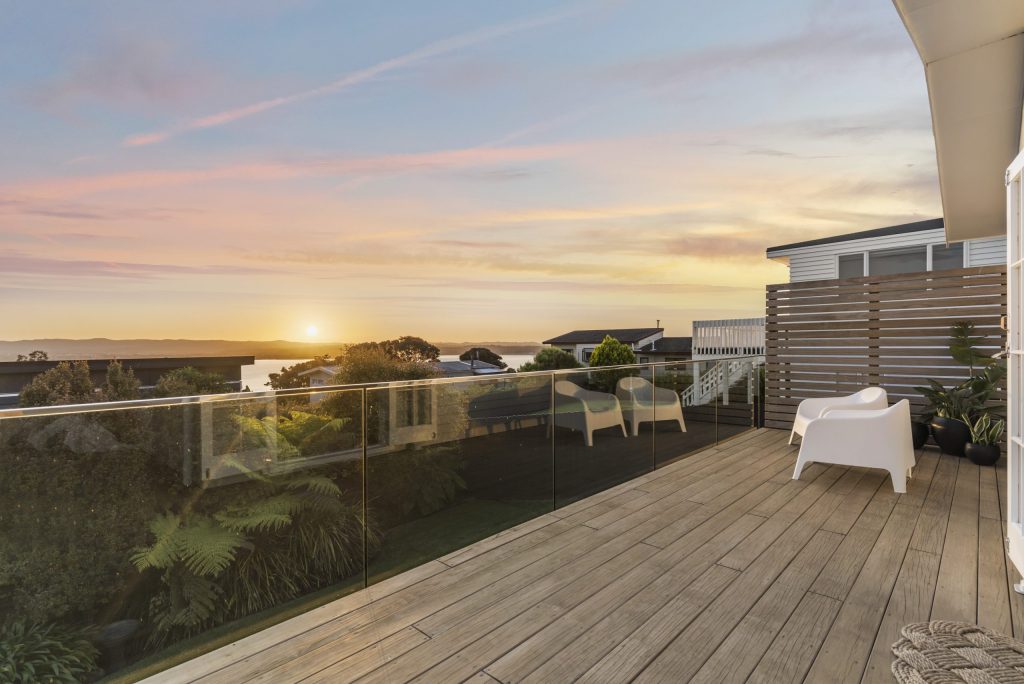
126 Rangatira Road, Beach Haven
Summer Loving
Deadline Sale: Closing Thursday 26th January 2023 at 4pm (unless sold prior)


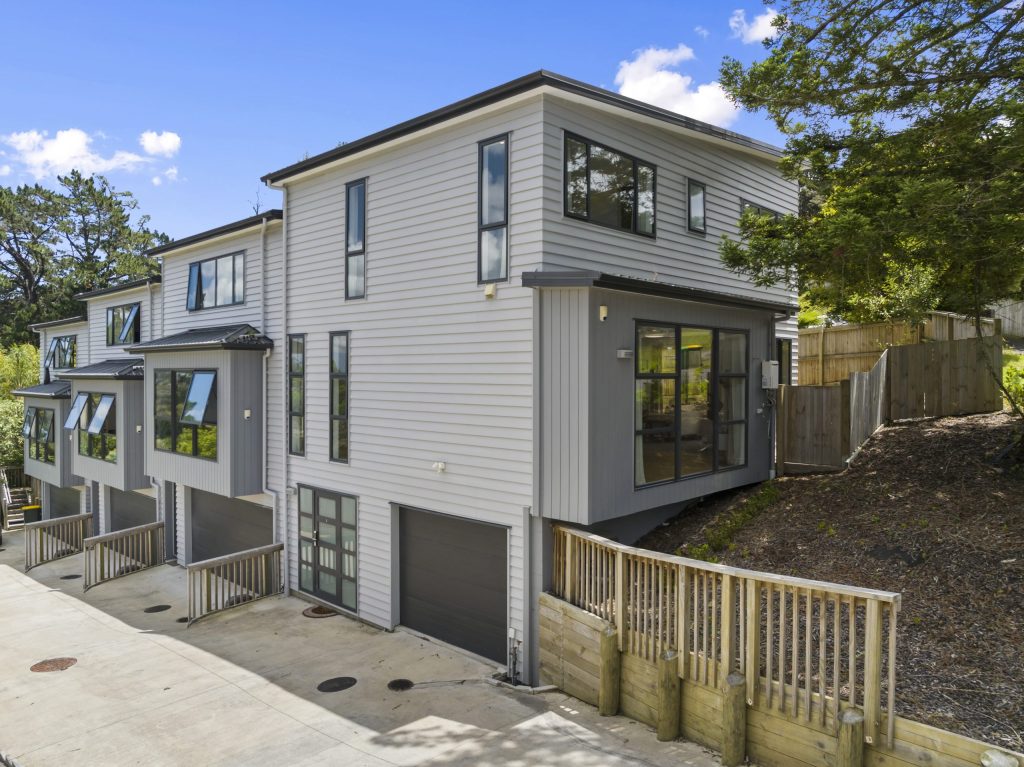

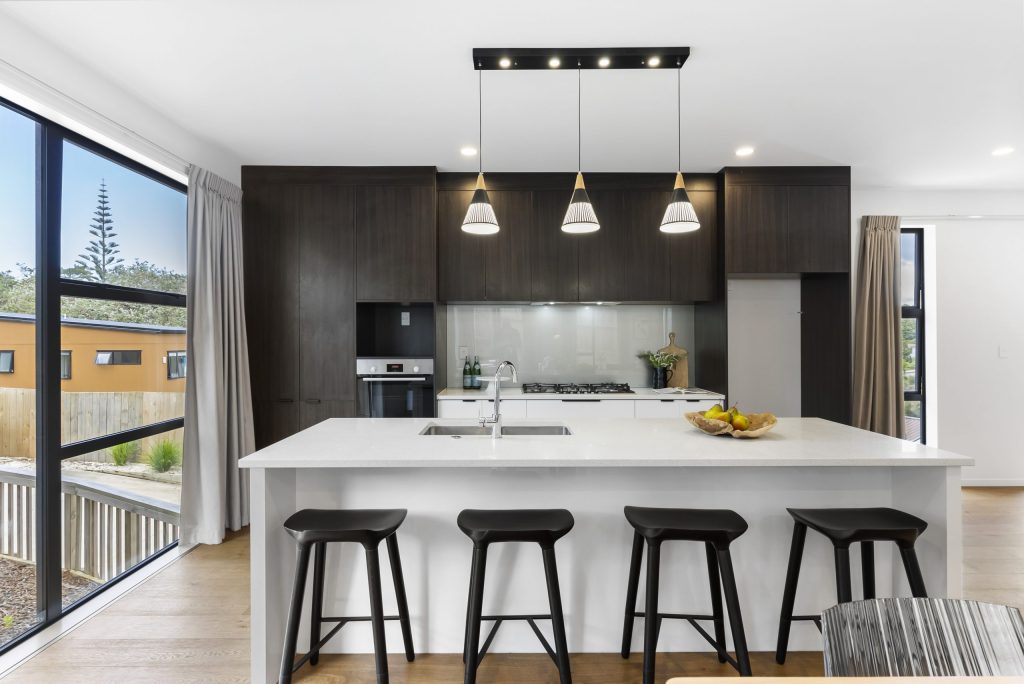
1/4 McQuoid Place, Glenfield
New Year, Near New Living
Deadline Sale: Closing Thursday 26th January 2023 at 4pm (unless old prior)


THE CUNNINGHAM GROUP


Leave a Comment