Trying to get this out before too many of you hit the pub for St. Patricks Day!
February REINZ data is out – more on that below but in short if you’re a normal person buying or selling a house to live in, the market is fine.
Let’s look at some numbers. We have drawn up another 7 offers this week and sold three properties now totalling 32 offers on 8 properties in 7 weeks, and all are either sold or conditionally sold. 6 of these were open homed and we had 255 inspections in total. Activity is fine.
If you’re a developer or investor it’s probably not a great time to sell, unless your investment is also a good home – but it’s a great time to buy.
If you’re a real estate agent, or even scarier a real estate company, the market is horrible lol. And that’s because despite what everyone says about commissions and prices going up etc. at the end of the day, our industry works on volume. And it’s currently the lowest we’ve seen It in decades.
But, for you, mr and mrs buyers and sellers of houses – volume doesn’t really matter – and in fact, neither do prices especially when they are down. Because we all know if you’re buying and selling in the same market, it doesn’t really matter.
What matters is activity – because without activity, you can’t sell your house, so you can’t buy your new house. First home buyers should love low activity and nobody buying because they have less competition – but generally we see first home buyers lacking the confidence to buy when nobody else is.
So my point is – activity at the moment, for houses, is really good. Therefore, the market, for houses, is pretty good, in my humble opinion. Development sites, investment properties, terraced townhouse new builds, off plans and apartments however – that’s another story for another day. With that being said, we sold an apartment off plans this week so maybe the tide is turning – based on our one sale haha.
Have a great weekend.
This Week’s Wrap
– The Short Story
– Market Performance
– Listings & Stock Availability
– Auction Results
The Short Story
Stock levels didn’t change much, nor did clearance rates which are still below par. Volume is lower than I’ve ever seen it across the board, and prices do appear to still be stabilizing certainly on the Shore, and potentially across Auckland as well. I know that’s a big old call, but there you go, I’m making it anyway.
Market Performance – REINZ data for February 2023
REINZ House Price Index
On the North Shore we saw a rebound in the HPI and median prices with growth of 2.77% following the big and unexpected drop of 4.25% from Dec to Jan. We wondered if last months drop was a catch up shift, or just one of those random stats that don’t fit the rest of the trends. Based on the Feb data it seems a little random, and aside from that stat we’ve now had 6months of reasonably stable prices on the Shore with the fall since the November peak hovering from 16-17% throughout the period, and currently sitting at 17.63%.
Across Auckland basically no change in the HPI – but the median price grew 7%! Prices are still down around 21.5% since the peak, the same as January. And across the country again very little change, with a slight increase of 0.14% to sit a little over 16% down for the second month in a row.
Median Prices
New Zealand – Jan $762,000 down 0.2% from Dec – Peak $925,000 (Nov 21) – 20% above Pre-Covid
Auckland – Jan $1.09 up 7% from Dec – Peak $1,300,000 (Nov 21) – 14% above Pre-Covid
North Shore – Jan $1.23m up 0.75% from Dec – Peak $1,550,000 (Nov 21) – 6.5% above Pre-Covid
Sales Volumes
Let’s put it like this, the average number of sales in February over the past 12 years is 320 sales. Last month there were 163 – about half the average and 38.5% down year on year. It’s basically the same for Auckland, down 41.4% and nationwide down 31.1%
Days on Market
The January and February data is impacted by the low volume lack, lack of listings and holiday periods leading to older stock selling, so the DOM’s at the moment are kind of meaningless in my opinion. For example on the Shore it’s recorded at 62 days, which isn’t a fair reflection.
Listings & Stock Availability
New listings are slowly coming in but not in the levels we are used to. This is putting pressure on stock and is probably why we are seeing the open home numbers we are seeing, despite the total volumes sitting quite high. There appears to be a lot on the market, but clearly not a lot that people actually want to see.
North Shore Stock Levels:
1476 on oneroof.co.nz – Last week 1471
1405 on TradeMe.co.nz – Last week 1390
1428 on realestate.co.nz – Last week 1425
Auction Results
We are still hearing stories of the odd great auction and well run campaigns in the central suburbs that are also selling well. Lot’s of positive signs floating around, but in the meantime clearance rates are still kind of average and below par. For us anyway, the Barfoot data is pretty consistent with where they normally sit.
Harcourts C&C
W/e 26/02 – 64% (9/17)
W/e 05/03 – 27% (4/15)
W/e 12/03 – 39% (7/18)
W/e 19/03 – 33% (2/6) with 3 more to call over the weekend
4 week average 39%
12 week average 38%
Barfoot North Shore
W/e 26/02 – 38% (8/20)
W/e 05/03 – 32% (8/25)
W/e 12/03 – 28% (8/29)
W/e 19/03 – 29% (5/17)
4 week average 32%
12 week average 28%
Combined 4 Week average: 35%
Combined 12 Week Average: 32%
Auctions with Active Bidders:
70% last week
59% over the past 4 weeks
That’s it from me, remember if you ever have any questions please just give me a call.
Stay safe this weekend.
Kris Cunningham & Team are all Licensed Sales People under the REAA 2008
UPCOMING AUCTION

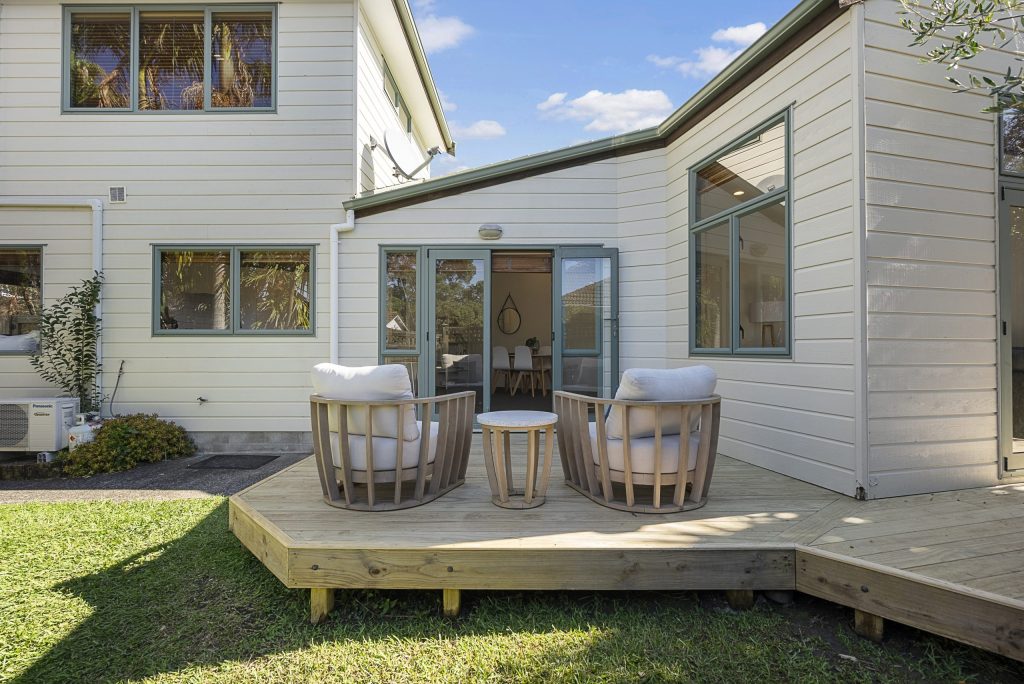
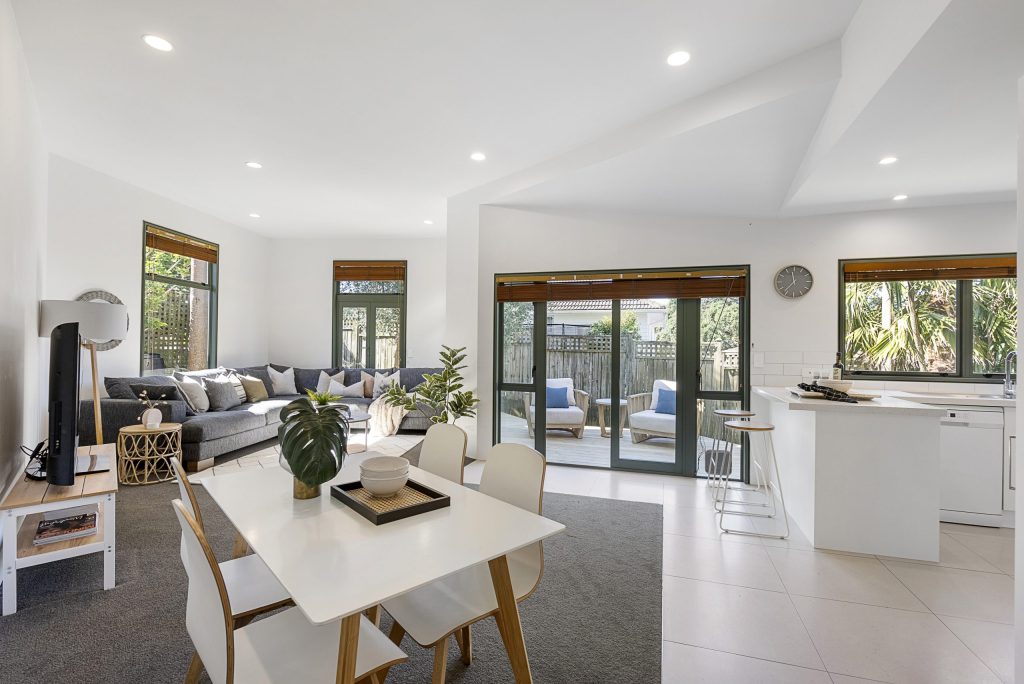
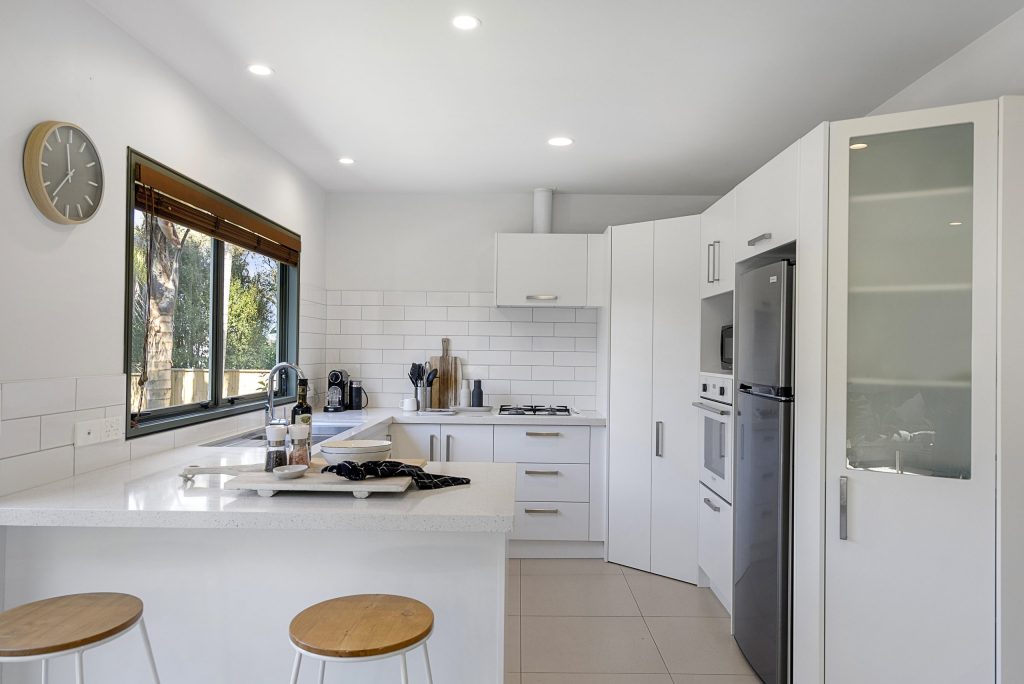
3/51 Corunna Road, Milford
Life in Milford starts here – Westlake Zone
Auction: Harcourts Takapuna, Thursday 23 March 2023 at 1pm (unless sold prior)


THE CUNNINGHAM GROUP


Leave a Comment